
How Power BI dashboards can Grow Your Retail Business?
The retail industry is more competitive and fast-paced than ever. Retailers deal with a massive volume of information every day, like supplier data, customer preferences and buying patterns, logistics data, inventory particulars, etc. However, the challenge is not only to manage this unstructured data but also to analyze it to achieve your business goals. For instance, you want your retail business to achieve higher sales. You want to reduce operational and customer acquisition costs. You want to provide great digital customer experiences. To maximize the potential of your retail business, you have to meet these requirements. How do you attain these?
Use Power BI Dashboards and Reports which have all the necessary metrics that you need to attain your business goals. Dashboards are a great way to monitor your business and see the most important metrics in one place. They can provide you all-important analytics and metrics that are of great value to your business and offer enhanced visibility. You can often dig deeper into your dashboard, exploring specific KPIs. This helps to identify challenges and issues you need to fix, as well as opportunities to pursue.
Retail Dashboards also empower retailers to identify buying and selling habits of their consumers, enhance inventory management, lower the rate of returns and ultimately increase sales as well as profitability.
Power BI Dashboards and Reports for Retail Industry
Retail organizations have to make decisions fast. While Excel sheets offer basic analytics, visual Power BI dashboards and reports can aggregate the data from multiple sources and unlock insights about Sales, Inventory, Customer Service, and much more. Power BI dashboards are user-friendly and easy to navigate, and data analysis is less intimidating than a spreadsheet with endless rows and columns. And when you customize dashboards to only display the information you require, data analysis is very fast and easy.
Using dashboards, business owners can visualize and track all-important retail KPIs in one central place and gain actionable insights. This means making informed decisions based on real data, not just assumptions. Also, it saves time since dashboards are updated in real-time with the latest data feed from the CRM or POS transactions.
The retail dashboard shows both real-time and historical data, so you can make informed business decisions with confidence. The historic analysis is also helpful for forecasting.
Retail dashboards contain a ton of information. You can usually customize it to show as much or as little data as you need.
Here are some highly intuitive and useful dashboards for the retail industry.
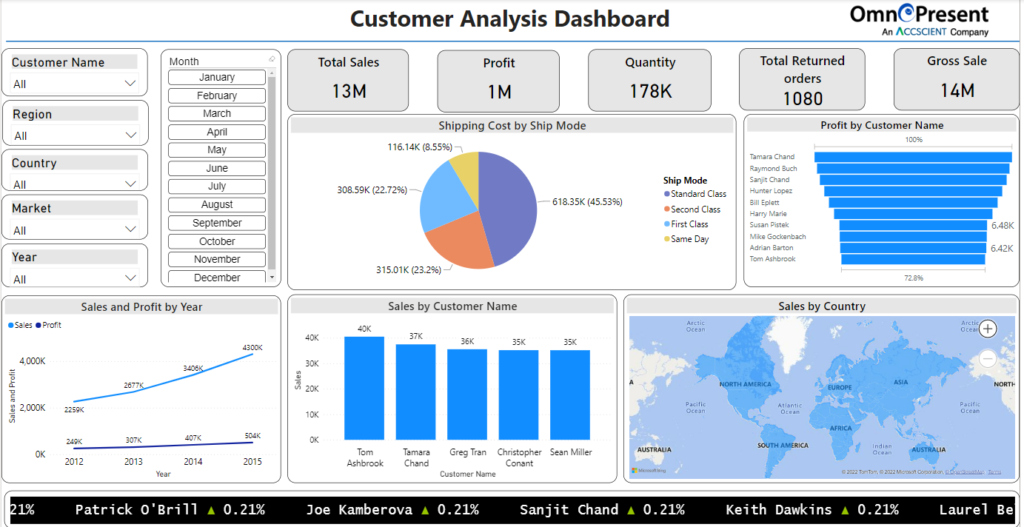
Customer Analysis Dashboard
Customer Analysis dashboard is rich with information about your customers. This information can give you the insights needed to develop effective marketing strategies, and in-store experiences.
It provides key analytics on sales, revenue, and profit data by product, customer name, geography, and sales channel. Using this dashboard, you can see total profit, growth compared to the previous year, and profit margins by customer. It helps businesses to understand the most profitable customers and look for similar customers to increase sales.
Retail Analysis Dashboard
The Retail Analysis Dashboard provides you all the information you need about brand performance within different buyer segments and gives you a deeper understanding of your sales funnel. The enriched retail dashboard offers a detailed, real-time view into the summary of major parameters like current year sales and profit, sales growth, and sales trend. The retail analytics dashboards offer an effective data visualization experience, with all required information on sales in a single go.
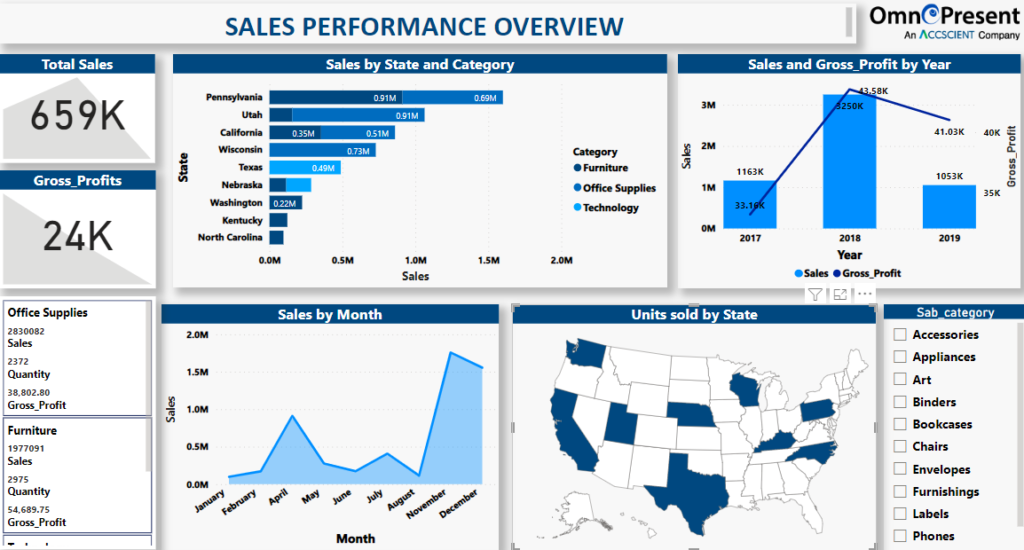
Sales & Order Overview Dashboard
Sales & Order Dashboard offers 360-degree sales monitoring with an effective graphical display. With this sales analysis dashboard, users can track total sales, orders, gross profit, and sales by states and country.
By analyzing sales, retailers can ensure that teams are achieving their set sales goals. Further, monitoring sales by country can help sales teams decide where to focus their outreach efforts.
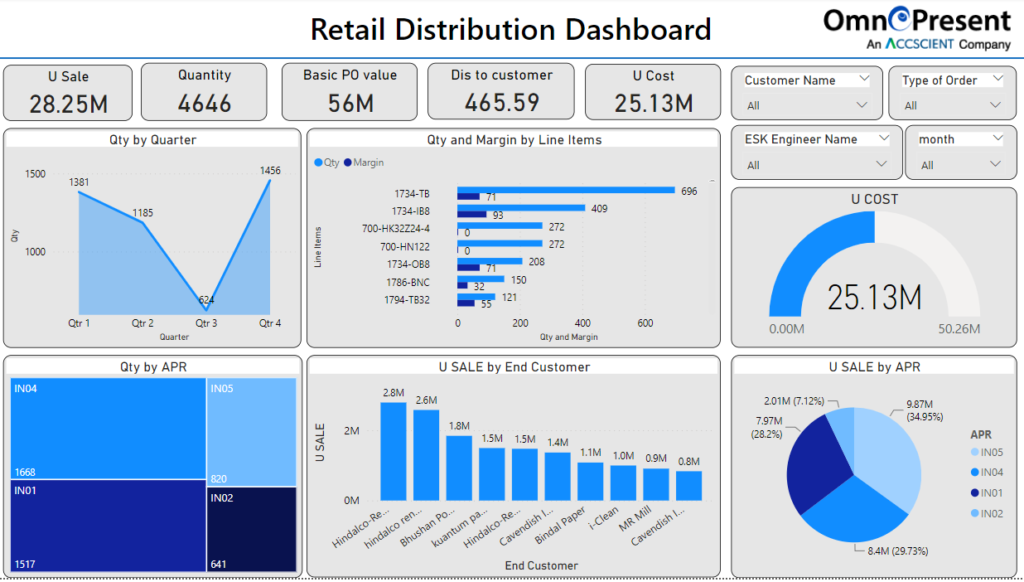
Retail Distribution Management Dashboard
This retail dashboard provides details on what’s selling well and where. It helps a retail business improve its performance, with a focus on distribution processes. You can measure product sales at each distribution point. You will also get profitability insights from different angles, such as Sales vs. Cost. It provides key factors that have the largest impact on profitability and improves sales team performance.
Conclusion
Being a retail business owner, you would want your stores to perform well and your sales team to achieve their targets and provide great digital customer service. You want to stay ahead of your competitors.
To achieve your goals, you can either spend hours analyzing your excel sheets or take advantage of Power BI Dashboards. With access to BI dashboards and reports, you can conduct predictive analysis, analyze competitors, track key performance metrics, optimize costs, and increase profitability.
However, at times, creating a perfect dashboard and implementing BI solutions can be slightly challenging. A Power BI consulting company can help you develop a data-driven strategy and provide customized Power BI dashboards and reports.
OmnePresent is one of the reputed Power BI consultants that deliver feature-packed Power BI dashboards that give you a multidimensional perspective for increasing the efficiency of your business operations.
Talk to our business intelligence expert today to evaluate your business needs.

RECENT POSTS
CATEGORIES